Researchers are uncovering the ways in which environmental factors such as air pollution, noise and green space can impact on people’s health with the help of increasingly detailed geocoded mapping of data in the 45 and Up Study.
Study System and Data Manager Tina Navin Cristina said geocoded address data based on latitude and longitude was now available for the baseline data on most of the 266,933 Study participants, as well as for the data from the two follow-up waves of the Study.
Researchers could access data based on the Australian Bureau of Statistic (ABS) Statistical Areas, Primary Health Network (PHN) or Local Health District (LHD) boundaries, she said. They can also access data on indexes of remoteness (ARIA), socioeconomic status (SEIFA) and education/occupation (IEO).
Ms Navin Cristina said a new variable, a transport hierarchy code, would soon be available on data from the second wave Study follow-up conducted 2012−2015, which included more than 140,000 participants. This new, more detailed data would show the type of roads on which people live, enabling researchers to drill down further when researching factors like air pollution, she said.
How researchers are using the data
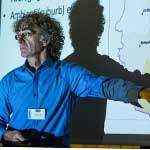
Associate Professor Geoff Morgan, environmental epidemiologist at the University of Sydney, is collaborating on a range of projects using the 45 and Up Study geocoded data to investigate how factors such as air pollution, green space, walkability, noise and climate impact on people’s health.
He is currently undertaking a research project using geocoded Study data to look at the relationship between health and neighbourhood air pollution in NSW. The project is exploring the effects of long-term exposure to neighbourhood air pollution in NSW on life expectancy, as well as hospital admissions and cancer.
Associate Professor Morgan said the increasing availability of health and environmental data at a finer spatial resolution could enhance the statistical power of epidemiological studies using the data.
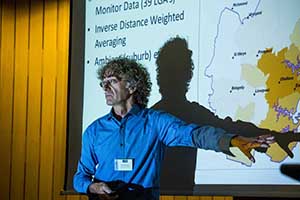
“Previously we’ve only been able to assess air pollution at very broad spatial units like the Sydney city region or the suburb. But averaging air pollution over these larger area misses higher level exposures, for example, next to major roads or industrial sources,” he said.
“Being able to look at exposure over a smaller spatial unit like the local neighbourhood will provide a much greater range of exposures for the participants in our studies and can substantially increase the statistical power of the study.”
The value of longitudinal data
Associate Professor Morgan said because the 45 and Up Study was following up participants over many years, it also gave researchers the opportunity to investigate the health impacts of changes in people’s local environment.
“We now have the ability to do studies looking at changes to someone’s local exposure to a factor like air pollution when they change from a high exposed to a low exposed neighbourhood or vice-versa. This means that we are now able to investigate whether these changes in exposure are reflected in changes to health factors we’d anticipate from those sorts of changes,” he said.
Ms Navin Cristina said six research projects were currently under way making use of geocoded data.
Find out more
- Researchers can find out more on the Questionnaire Variables document within the Researcher Toolkit
- Sign up to receive updates on the 45 and Up Study and the Sax Institute